 Elvermont
From photons to evidence.
How Elvermont turns raw multispectral captures into measured, dated and verifiable statements about change on the ground — and why every figure can be traced back to the exact capture that produced it.
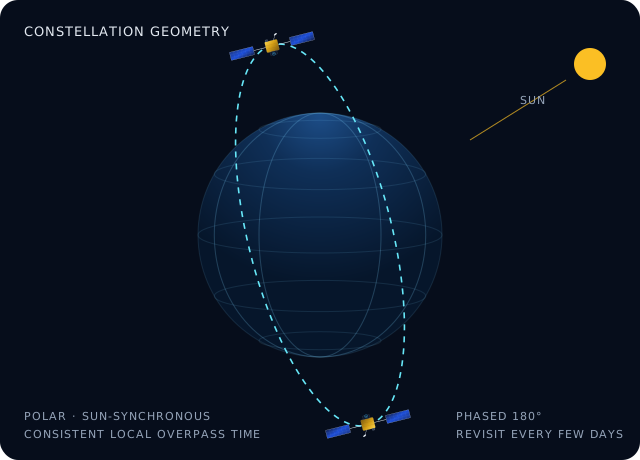
A consistent view, every few days.
Imagery is captured by polar-orbiting, sun-synchronous satellites that cross each latitude at the same local time. Consistent illumination makes captures comparable across months and years. Paired spacecraft phased half an orbit apart revisit the same ground every few days, and a multi-year archive lets us look back at what a site looked like before anyone asked.
- 13 spectral bands from 443 nm to 2190 nm
- 10 m ground sampling in the visible and near-infrared; 20 m in red-edge and short-wave infrared
- Surface-reflectance products, atmospherically corrected
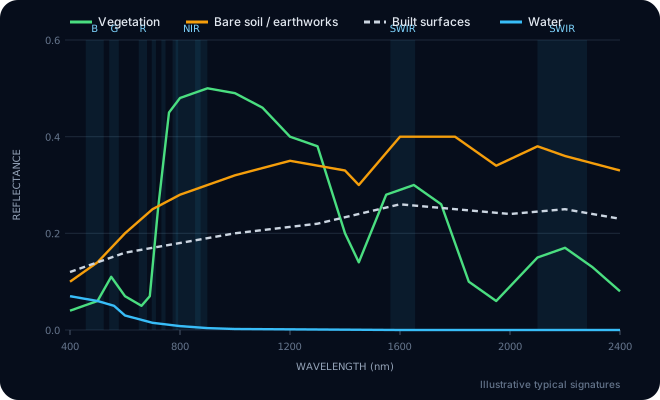
Every surface has a fingerprint.
Vegetation reflects strongly in the near-infrared and absorbs red light; bare soil brightens steadily into the short-wave infrared; water absorbs almost everything beyond the visible. Measuring these signatures pixel by pixel lets us separate clearance from cultivation, hardstanding from bare earth, and water from shadow.
Physics-based indices, computed per pixel.
vegetation vigour · −1 to +1
exposed soil and earthworks
open water
built and engineered surfaces
Cloud & shadow, pixel by pixel
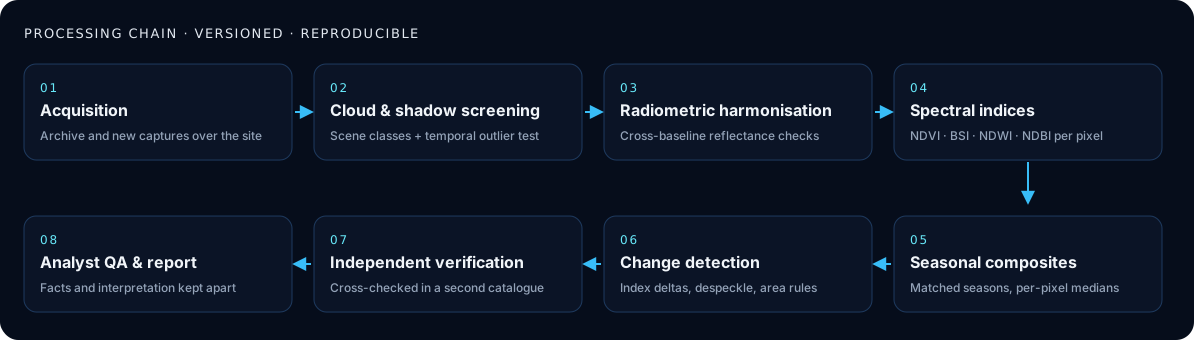
Each capture is screened with a per-pixel scene classification, then a multi-temporal test removes bright transient outliers that single-scene masks miss. Captures with too little clear view over the site footprint are rejected and recorded as such.
Radiometric consistency
Processing baselines change over the years. Every capture is checked empirically for reflectance offsets before it is compared with another, so a change in the data pipeline is never mistaken for a change on the ground.
Like-for-like seasons
Multiple clear captures from matching months are combined into per-pixel median composites. Comparing the same season year to year removes the farming calendar and leaf-on/leaf-off effects.
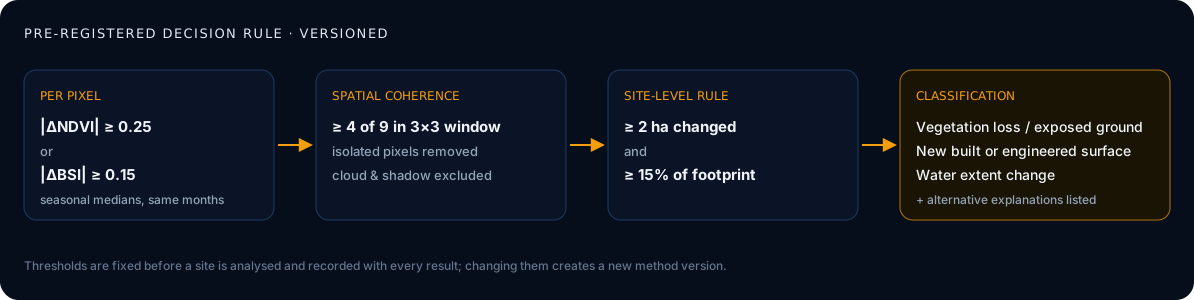
A pre-registered decision rule.
Thresholds are fixed before a site is analysed and stored with every result. Changing a threshold creates a new method version; historical results are never overwritten.
The full processing chain.
Independent verification
Every capture used in a result is cross-checked against a second, independent archive catalogue — including reprocessed versions of older acquisitions.
Analyst review
A person reviews every result before it is issued. Measured facts and interpretation are reported in separate sections, with alternative explanations listed.
Full provenance
Each figure carries the capture date and time, satellite, cloud over the site, processing version and the rule that produced it.
Measured against independent records.
We tested the method blind against an independent UK government register of energy projects: 3 large solar farms recorded as built, and 3 long-established sites where no construction was expected. Thresholds were registered before the test.
A small test (6 sites, evaluated 08 November 2026), so indicative; it is extended continuously and every new result is recorded.
| Recorded construction detected | 3 of 3 |
|---|---|
| Unchanged sites wrongly flagged | 0 of 3 |
| Detected change at recorded builds | 22–30 ha per site |
What the method does not claim.
Resolution
10 m pixels: we report change across tens of metres and hectares, not individual vehicles, people or small structures.
Weather
Optical sensors cannot see through cloud. Usable views over a site can be weeks apart, especially in winter; we state exactly which captures were used.
Not a survey
Results are observational evidence, not surveys, valuations, planning or legal certification.
Not continuous
Captures are periodic snapshots. We never describe them as live or continuous surveillance.